| Name | Last modified | Size | Description | |
|---|---|---|---|---|
| Parent Directory | - | |||
| README.html | 2024-01-19 15:03 | 2.4K | ||
| README.md | 2024-01-19 15:05 | 1.2K | ||
| jana_papagayo_plots.ipynb | 2024-01-29 15:35 | 1.0M | ||
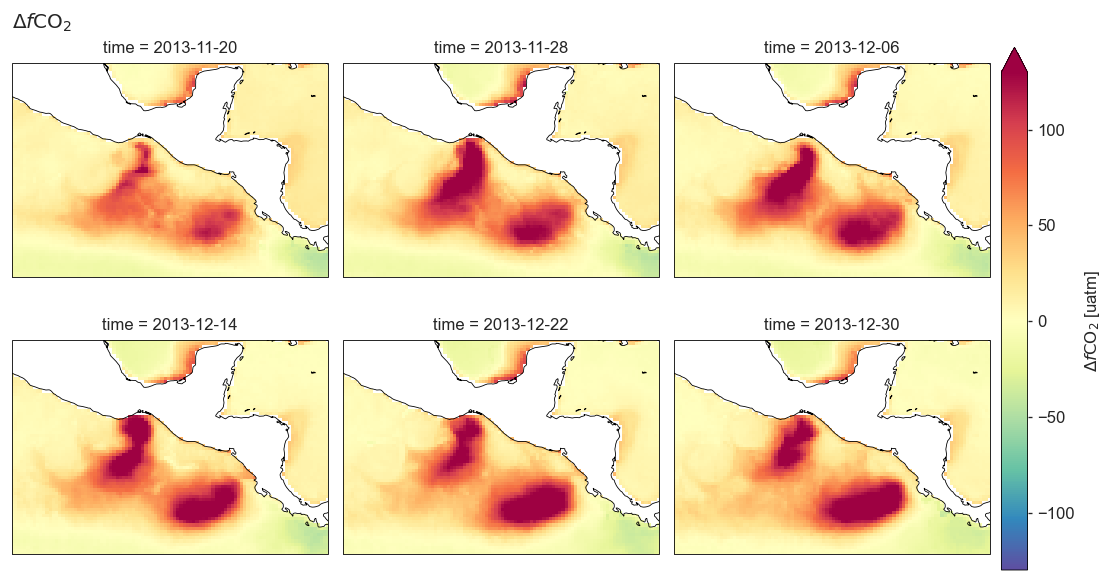
| oceansodaHR-papagayo-dfco2.png | 2024-01-19 14:55 | 151K | ||
| oceansodaHR-papagayo-fgco2.png | 2024-01-19 14:55 | 129K | ||
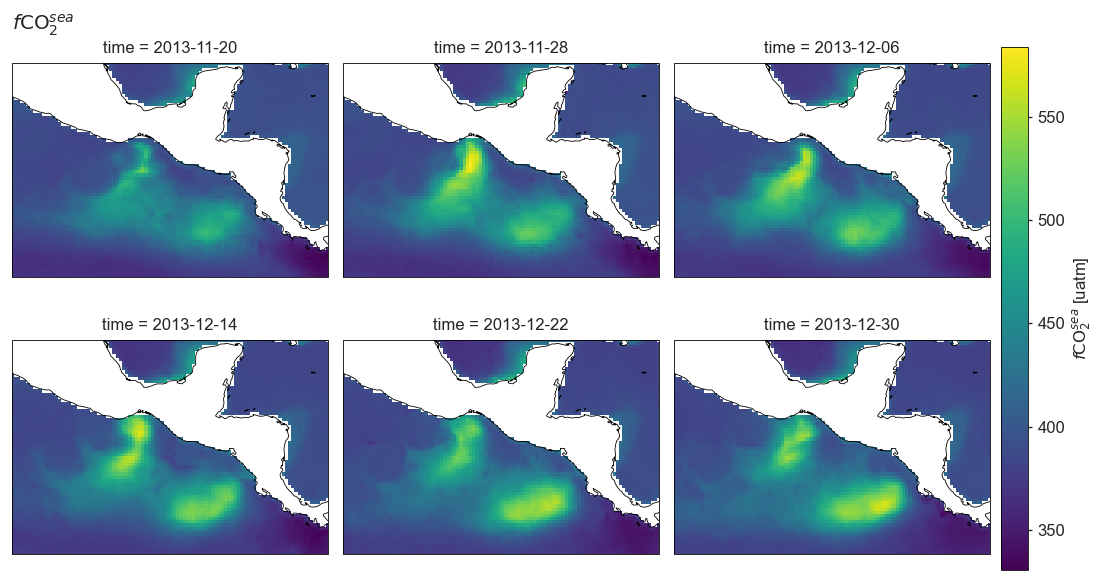
| oceansodaHR-papagayo-sfco2.png | 2024-01-19 14:55 | 149K | ||
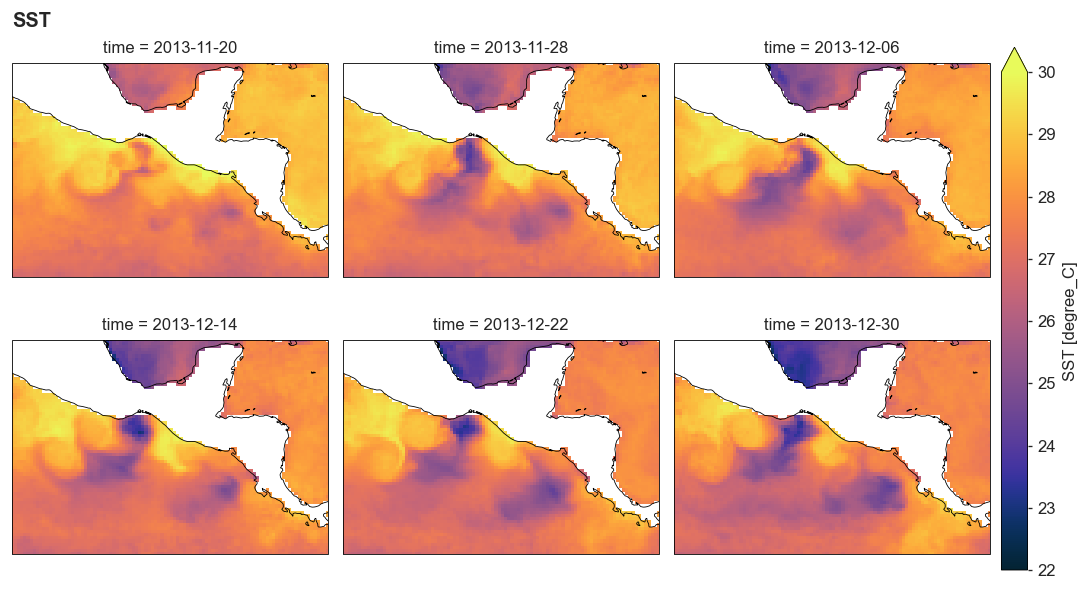
| oceansodaHR-papagayo-temperature.png | 2024-01-19 14:55 | 168K | ||
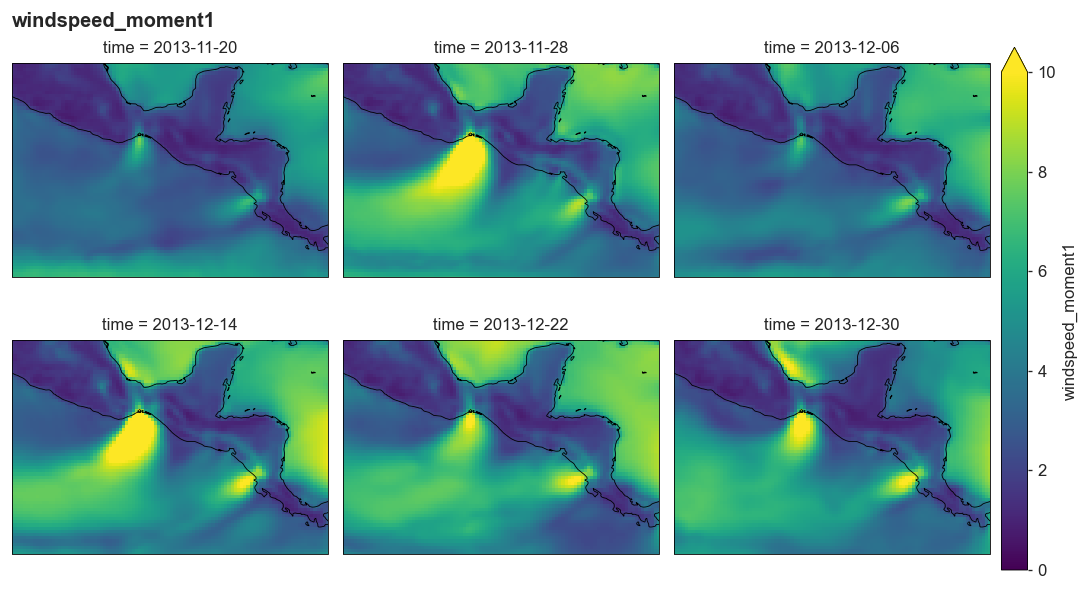
| oceansodaHR-papagayo-windspeed_moment1.png | 2024-01-19 14:55 | 172K | ||
Based on a request by Niki and Jana
Dear Jana,
Hmm. Ideally you would catch the situation before, during, and after the gap wind event. It’s great to know that you are no longer constrained by the EEZ, so if possible move it closer to the core than further away. Of course, the winds will be hauling during the event, so perhaps a stronger focus on post event is the way to go. Thus perhaps a cruise track that starts from the south-east in the shadow of the Nicoya penninsula and then progressing into the core of the Papagayo upwelling region. A later cruise to the same place would be fantastic to sample the contrast :-)
I copy this to Luke. He maybe able to send you a couple of snapshots of the fCO2 fields before, during, and after a Papagayo event.
The files to process everything, and the plots.
